We are into our second year of surveying with the Kellogg Creek Student Macroinvertebrate Monitoring Program. This spring we were blessed with sunny survey days, enthusiastic students and hard working volunteers who helped make the season happen! This season we continued our collaboration with Milwaukie High School and Rowe Middle School, and added in new weekend Community Surveys for volunteers interested in helping supplement students data. Right now, we are collecting valuable pre-restoration data that can determine the baseline macroinvertebrate communities in Kellogg Creek and overall stream health prior to the removal of Kellogg Dam. With a year of surveys under our belt, we can now compare what we are finding between seasons and years. Our goal is to get several more years of pre-restoration data before the removal of Kellogg Dam in 2028!
A big THANK YOU for this season goes out to:
- Nicole Matthews and the Milwaukie High School biology students
- Dylan Richmond, Jeff Young and the Rowe Middle School 6th, 7th and 8th graders
- Entomologist Zee Searles Mazzacano, pHD, CASM Environmental
- Educate Ya and IRCO who provided translations and interpreters for the program
- And all of our macroinvertebrate survey volunteers!
This video from the North Clackamas School District shows students at Rowe Middle School on a spring survey!
Survey Results
We conducted surveys at 4 sites: the confluence of Kellogg Creek and Willamette River, in the Kellogg Impoundment from Dogwood Park and the Milwaukie Presbyterian Church Sanctuary, and upstream of the impoundment behind Rowe Middle School. In addition to surveys conducted with classrooms from Milwaukie High School and Rowe Middle School, we held three weekend community surveys at the Kellogg/Willamette confluence site to supplement classroom data.
For more information on survey and analysis methods, check out the Fall 2024 results page here.
Survey Effort
The table below summarizes the number of surveys at each each site, the total number of samples collected at the site, the average number of macroinvertebrates counted during a survey, and the average number of macroinvertebrates counted per number of samples collected. Something that we keep in mind when looking at our data is the amount of “effort” put into each site – how many surveys were at the site and the number of samples that were collected. One thing that has been apparent from the last few seasons of monitoring is that surveys at Rowe Middle School often have greater amount of effort, both due to a larger number of surveys and larger class sizes which result in more samples being collected. When effort is skewed across survey sites, it can make it more difficult to make comparisons between them. With lower sampling effort you may not collect enough samples to fully represent the diversity of a site, and miss some of the more rare taxa that could be present. In future seasons, we will continue to work with teachers and community members to more evenly distribute our survey effort, with increased community surveys used to supplement student data.
| Survey Sites | Number of Surveys | Number of Samples Collected | Mean Macroinvertebrate Counts | Mean Abundance/Samples Collected |
| Kellogg Creek (Willamette Confluence) | 2 | 15 | 57 | 7.6 |
| Kellogg Impoundment | 5 | 57 | 61 | 5.36 |
| Kellogg Creek (Rowe) | 5 | 105 | 165 | 7.8 |
Survey Findings
The table below summarizes interesting findings from our survey season, including total taxa abundance at each site and which taxa was most abundant. The percentage of mayflies, stoneflies and caddisflies found at each site ( %EPT ) and percent midges. A high percentage of EPT may indicate a healthier stream, whereas over 30 % midges generally indicates a more degraded habitat.
| Survey Site | Taxa Richness | Most Abundant Taxa | % EPT | % Midges |
| Kellogg Creek (Willamette Confluence) | 12 | Sowbug | 1.7% | 13.9% |
| Kellogg Impoundment | 17 | Sowbug | 0% | 16.9% |
| Kellogg Creek (Rowe) | 17 | Scud | 4.8% | 2% |
Data Analysis
Below are the results of the Community Science Index of Biotic Integrity. On this index higher scores are associated with healthier streams, so the sites that are represented in red are considered impaired, while the green and yellow sites are healthy and moderately impaired respectively.
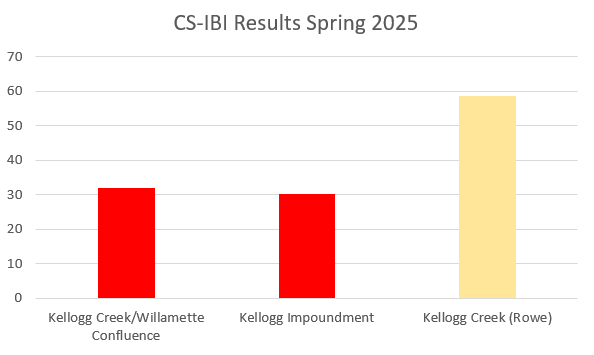
The chart above shows the average CS-IBI score at each survey site, with the two sites within the Kellogg Impoundment (Milwaukie Presbyterian Outdoor Sanctuary & Dogwood Park) combined. Now that we are in our second year of surveys, we can begin to compare results across years. Overall, the findings from spring 2025 closely align with those from spring 2024 (results available here), suggesting consistent patterns in stream health over time.
Both the Kellogg Creek Confluence site and the sites within the Kellogg Impoundment scored low on the CS-IBI in both years, indicating impaired conditions. In the spring 2024 analysis, sites within the Kellogg Impoundment were evaluated separately: the Sanctuary site scored slightly higher and was considered moderately impaired, while Dogwood Park was classified as impaired. In 2025, these two sites were combined for analysis, and together they received a CS-IBI score of 30, placing them in the impaired category.
In contrast, the survey site at Rowe Middle School – located along a free-flowing section of Kellogg Creek – scored substantially higher in both years. In 2024, the Rowe site received a CS-IBI score of 74, which is considered unimpaired. In 2025, the average score at Rowe was lower at 59, placing it in the moderately impaired category. This change is likely driven by differences in the percentage of EPT taxa (mayflies, stoneflies, and caddisflies) observed between years, with notably higher numbers of mayflies and caddisflies recorded at the Rowe site in spring 2024 contributing to the higher score.
Despite year-to-year variation at the Rowe site, the results consistently show that this unimpacted section of Kellogg Creek supports healthier biological conditions than areas of the creek that are heavily influenced by Kellogg Dam. We will continue to collect data at these sites seasonally (fall & spring) in the years leading up to and following the removal of Kellogg Dam.
